China's Population Could Shrink to Half by 2100

https://www.scientificamerican.com/article/chinas-population-could-shrink-to-half-by-2100/

China’s population of 1.4 billion people is the largest in the world, right? Not anymore. In 2023 India surpassed China as the most populous country. China’s population began shrinking in 2022, and the latest United Nations report indicates that it could slip to 1.3 billion in 2050 and then plummet to only 770 million in 2100.

As this news spreads, warnings of a looming crisis are growing louder. Perhaps most concerning of these is that China will not have enough young people to grow the economy or support older adults. But China’s declining populace could be a cause for opportunity rather than a crisis. China could arrive at a stable and sustainable population of around one billion in 2100. At this level, it is possible for the country to remain a global superpower and for its citizens to become even more prosperous, with its older adults well cared for. And China’s experience in making this transition could provide valuable lessons for many other countries that will have a declining population in the coming decades.


On supporting science journalism

If you're enjoying this article, consider supporting our award-winning journalism by subscribing. By purchasing a subscription you are helping to ensure the future of impactful stories about the discoveries and ideas shaping our world today.


The Chinese Communist Party has flipped its population policy twice since assuming power in 1949. Initially the policy was very pronatalist—it promoted reproduction and a high national birth rate. Then in 1979 a strict one-child policy was adopted alongside the economic reforms launched by former leader Deng Xiaoping that fueled China’s extraordinary economic rise. In 2015, prompted by a sharply falling birth rate, a pronatalist policy was reintroduced that allowed two-child families, and a policy that allowed three-child families was introduced in 2021.

The most recent policy statement came from Chinese president Xi Jinping in his address to the 13th National Women’s Congress in October 2023: “We should actively foster a new type of marriage and childbearing culture.” Other addresses at the Congress reflected a shift away from gender equality, even to the point of suggesting that women leave the labor force to have children. Such pronatalist policies run against the sentiment among a large segment of China’s youth, however. And many people do not want to have one or more children.

China’s population decline raises fundamental issues about childbearing, dependency ratios and “optimum” population size. Demographers have a way of describing a country’s population in a graphic: the population pyramid. It shows the number of male and female members of a population at a point in time, typically in five-year age groups, which is helpful for understanding societal issues.

China’s population in 1980 was around 980 million. It was distributed in the classic pyramid shape of a growing population: wider at the younger ages and narrower at the older ages. (See the graphic below.) One quirk was that there was a slightly smaller 20–24 age group than the 25–29 age group because of disruption caused by the Cultural Revolution, which began in 1966. The 15–19 and 10–14 age groups reflected a rebound. But the beginning of the 40-year trend toward smaller age groups could be seen in the five-to-nine and zero-to-four age groups. China’s one-child policy reinforced this trend, but other factors contributed, such as rapidly rising incomes, education, urbanization and better access to birth control.
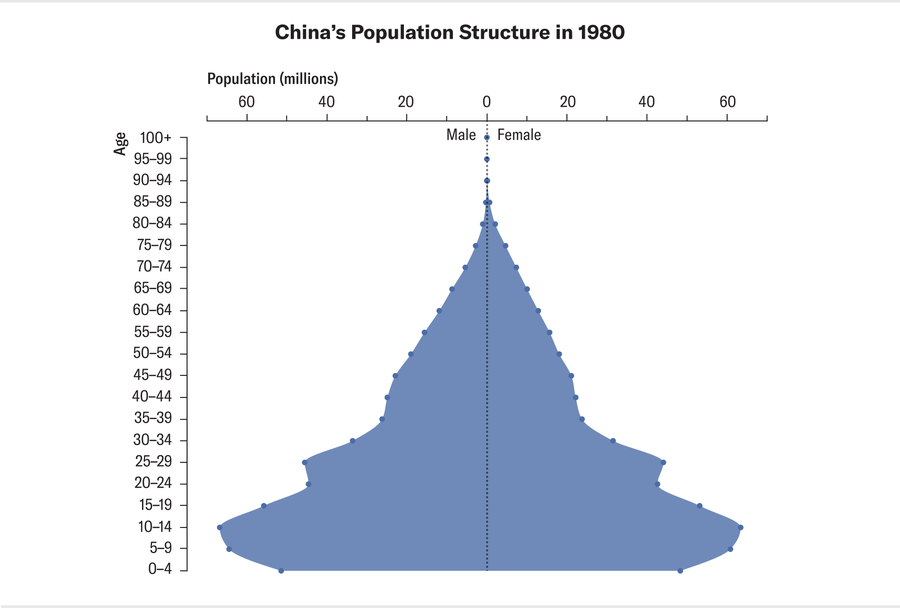
Chart shows China’s population distribution in 1980 in five-year age groups.

By 2020 these factors dramatically changed the shape of China’s population pyramid as its total population peaked at around 1.4 billion (below). The “bulge” of older people that is widely viewed as a future crisis can be clearly seen in the increased number of people aged 30–59.

An important factor is the dependency ratio, which compares the “dependent” population of youth (zero to 14 years of age) and older adults (aged 65 and older) to the working population between the ages of 15 and 64. In 1980 China’s ratio was 68 dependents for every 100 people of working age. In 2020 it was a more favorable 44 per 100. The coming bulge of older adults, however, will push the ratio up to a potentially socially destabilizing level—as much as 89 per 100 around 2085, according to our calculation.

Chart shows a comparison of China’s population structure in 1980 and 2020 and its dependency ratio in 2020 and 2050.

It is useful to put these images into a broader historical and global context. Around 1900 the global population began growing exponentially. The increase was driven primarily by falling death rates and reflected improvements in sanitation and public health. This trend produced a “demographic transition” from the historic pattern of birth rates closely matching death rates that yielded a slowly growing human population over millennia.

Around 2000 a global transition in the opposite direction became increasingly visible: birth rates started to fall below death rates, which began setting the stage for shrinking populations and rising dependency ratios. Almost all high-income and middle-income countries now face these prospects. Many of the countries with a population growing faster than 1 percent per year are low-income countries in Africa.

The population pyramids for India and Japan illustrate these trends. India’s pyramid (below) has the classic shape of a growing population. India has a favorable dependency ratio of 47 and a median age of 27.9—although smaller age groups at the bottom of the pyramid signal the beginning of the country’s transition toward a smaller population. The trend is too weak, however, to provide relief for India’s very high level of youth unemployment, which is considerably greater than China’s and has the potential to create social turmoil.
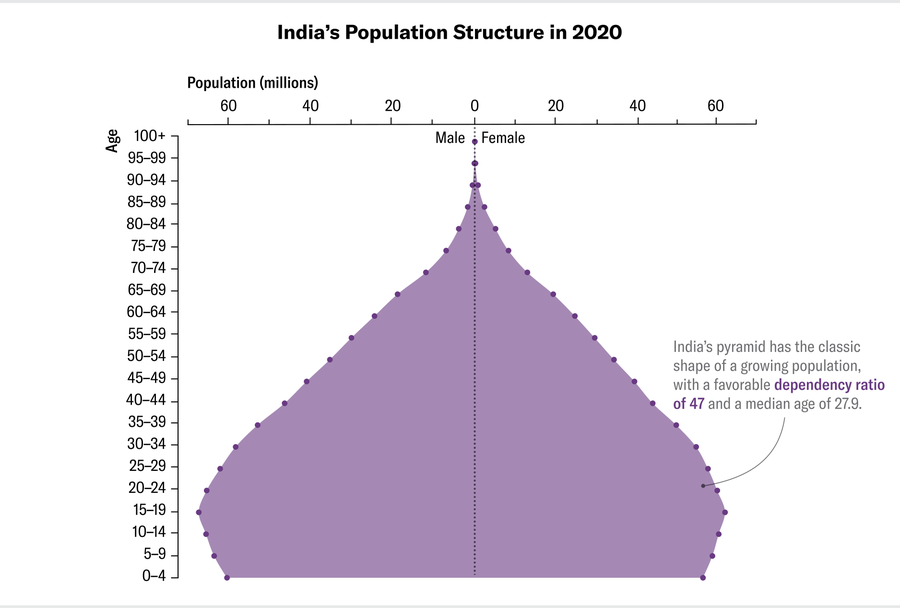
Chart shows India’s population distribution in 2020 in five-year age groups.

Japan’s pyramid is distinctly top-heavy, with an unfavorable dependency ratio of 71 and a median age of 48.7, reflecting a strong demographic transition that began 45 years ago. It is hard to avoid a sense of crisis. The U.N. forecast has Japan’s population falling from 125 million in 2020 to 75 million in 2100.
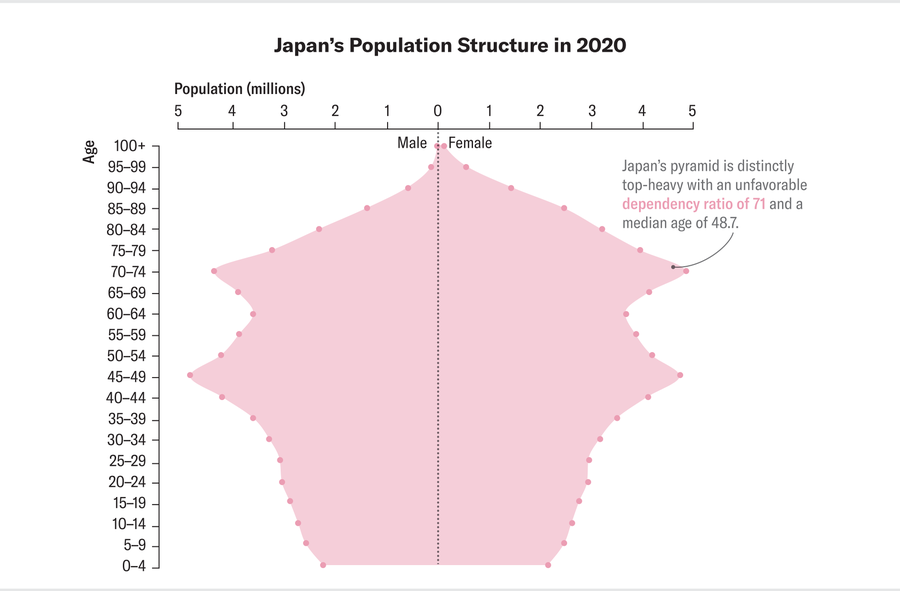
Chart shows Japan’s population distribution in 2020 in five-year age groups.

A country’s population is shaped primarily by its birth rate and death rate. In today’s world, with widely available means of family planning, the number of births in high-income countries is largely determined by the number of children people want to have. The number of deaths is determined by a complex set of biological, social and environmental factors. Migration is an important factor in some countries.

The total fertility rate (TFR) is the number of children an individual of childbearing age will have, on average, in their lifetime. A TFR of 2.1 yields a stable population over time. Population will rise in a country with a TFR above 2.1 and fall with a TFR below 2.1. In 2020 Niger had the world’s highest TFR, at 6.89. South Korea had the lowest, at 0.89.

China’s TFR was 5.8 in 1970. Over the next 20 years it slid slowly and then rapidly toward the replacement level of 2.1. In the 1990s it dropped much further, and it reached a U.N. estimate of 1.18, one of the lowest in the world, in 2022.

For any country a TFR this small is bad news. But people who see China’s low rate as a crisis are misled by a common forecasting practice that often leads to unrealistic conclusions: they are extrapolating China’s current rate indefinitely into the future. In particular, the U.N. World Population Prospects report for 2022 used a roughly constant TFR of 1.18 to forecast that China’s population will fall to 770 million in 2100.

The pyramid that results from this forecast (below) is dramatically different from the one for 2020. The 770 million number comes from the U.N.’s “medium scenario.” The high scenario is 1.15 billion and the low scenario is a shocking 494 million.
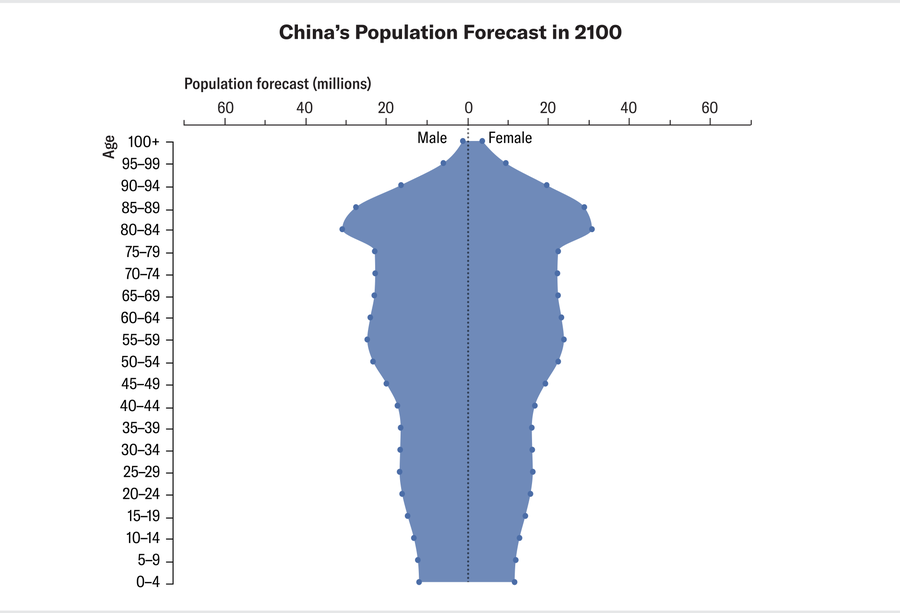
Chart shows China’s population distribution forecast in 2100.

But the pyramid above is just a snapshot of what this will look like. As the years advance, the bulge of older people in China’s 2020 pyramid will move up and peak around 2050. And unless some medical breakthroughs prolong life expectancy well beyond 100 years, the bulge will be gone by 2130.

In other words, China has 27 years (from 2023 to 2050) to adjust to the peak bulge of its older population and then another 80 years (from 2050 to 2130) during which the bulge will shrink steadily until it has disappeared. This bulge should be manageable because it is a transition phenomenon playing out over decades and because it might not take radical policy reforms in the short term to make life pleasant for people who have reached retirement age.

In 2019 the Chinese government released a “National Mid and Long-Term Plan for Actively Responding to Population Aging.” In the decades ahead, the most obvious policy adjustment would be to keep people in the workforce longer. Most men in China currently retire at age 60, whereas women in white-collar jobs retire at age 55 and women in blue-collar jobs at age 50. The 2019 plan set the stage for the Chinese government’s announcement in 2021 that it would gradually increase the legal retirement age.

China's aging population is already spurring rapid development in the caregiving industry. In Shanghai, for example, an online platform has been created that connects families seeking caregiving assistance with available caregivers. China might find useful ideas from other countries, too. The political pressures in Japan, Korea and Taiwan to address their bulge in the older population is especially strong, and these countries may implement some effective policies and programs. A great deal of experimentation is underway in European countries, most of which have TFRs below replacement level. In the U.S., one response is the aging-in-place “village movement,” which is helping older adults in urban communities to remain in their own home through cooperative support.


Today the social environment for Chinese people of childbearing age is uncertain and confusing. Chinese women are caught between the patriarchal demand that treats childbearing as normative and the authoritarian state’s pronatalist push, said Yun Zhou of the University of Michigan in a November 2023 webinar.

The biggest drivers of China’s falling TFR appear to be the generally rising living standard and educational advancement of women. Most empirical evidence around the world shows that women with more education have fewer children. This partly comes from marrying later. It is also caused by not wanting to lose income by leaving work to raise a child. One obvious policy adjustment would be to greatly expand childcare facilities. Another would be to adopt generous maternity leave policies with continuing employment guaranteed.

Future trends worldwide are also unclear. Artificial intelligence and robotics will be powerful drivers of change, for example. The policy challenges for all countries with a shrinking population will be great, and they are likely to be even greater for countries with a growing population. Nigeria, for example, is on track to double its population in the next 40 years from around 220 million to 440 million people, overtaking projections for the U.S. as the third most populous country in the world.

Underlying everything the government of China is considering to slow its population decline—and the reactions of commentators who see the decline as a crisis—is concern that a smaller population will make China economically weaker and diminish its influence in the world. This is where public opinion and policy debate may be the most misguided.

If the measure of economic progress in China is growth in gross domestic product (GDP), then a shrinking population would be a contributing factor holding back GDP growth. But China’s population is becoming better educated. The country is also installing more industrial robots than any other nation. There is no plausible reason to believe that China’s economic productivity will stop increasing. There is also no experience in the rest of the world that validates the concern that a smaller population will undermine China’s status as a global superpower.

The size of a country’s population has never been a good measure of the well-being of its inhabitants, either. Economists have not yet adopted a widely accepted way of measuring well-being. But China now has the potential to pioneer policies that stabilize a shrinking population, raise productivity and enhance well-being. These policies can inspire other countries in the same situation while at the same time helping the world overcome the existential threat of climate change.


Curiously, the debate about population in China—or the world—is never cast in terms of an “optimum population size.” Debates on setting specific targets for population size or growth have become contentious because of concerns over coercion. In addition, there is a prevailing perception in the Global South that population stabilization efforts are strategies favored by the Global North so it maintains its hegemony.

Yet worldwide it seems clear that no population larger than the current eight billion is sustainable at the current living standard of the global middle class. It is even less sustainable at the standard of high-income countries. The U.N. could contribute meaningfully to the climate-change debate by identifying an approximate population size for the world in 2050 or 2100 that would be more sustainable given resource and technology constraints.

A robust concept of optimum population size is not static, however. It changes over time as technology advances, natural resources are extracted and countries evolve socially. For example, there may be a time when a global population greater than eight billion will be sustainable if nuclear fusion power becomes feasible and vegetarian protein replaces meat-based protein in diets. It should also be scientifically possible to identify a smaller global population that can be supported at a generally higher standard of living without aggravating global warming and reducing biodiversity.

We are not proposing an optimum population size for China. But here is one plausible scenario toward a smaller and more sustainable population, albeit one that many demographers might deem overly optimistic. On this path, which we have calculated, China’s TFR stabilizes for the next 20 years and then starts rising, approaching the 2.1 replacement level around the beginning of the next century. That yields a total population around 1.2 billion,in contrast to the U.N.’s forecast of 770 million. Based on an alternative demographic path we calculated, China’s population pyramid in 2100 would look much less alarming (below). China could become even more influential globally if it follows this kind of path.
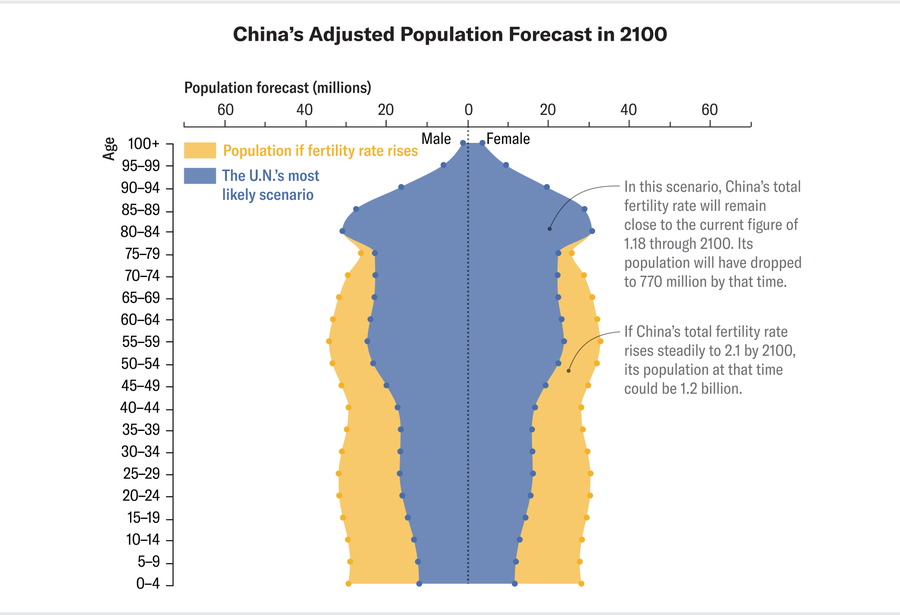
Chart shows China’s adjusted population forecast in 2100 if fertility rate rises.

In general, countries with a declining population need not make policy adjustments with great urgency. Changes can be adopted over several generations, with lots of experimentation. Indeed, with no fanfare, a lot of adjustments are already moving countries in the direction of smaller and more harmonious populaces.

For example, governments in many countries are reassessing mandatory retirement ages to encourage more years of employment. They are changing pension schemes to make them fiscally sustainable for longer periods. They are making it easier for people to have children by making fertility treatments more accessible, extending parental leave and expanding childcare facilities. Perhaps the most crucial policy reforms will be those that support a very different work-life balance as artificial intelligence and robotics redefine employment. Some radical solutions will inevitably emerge, possibly including the implementation of a universal basic income for all adults.

Fundamentally, the decisions made by young and old people in countries with a declining population will determine how quickly and smoothly a country arrives at a stable and sustainable population. Policies will shape the path, but the bottom-up actions of the people will be the difference between countries that make the transition peacefully and those that experience serious disorder.

{
"by": "sohkamyung",
"descendants": 16,
"id": 40222947,
"kids": [
40224757,
40223173,
40224478
],
"score": 25,
"time": 1714570261,
"title": "China's Population Could Shrink to Half by 2100",
"type": "story",
"url": "https://www.scientificamerican.com/article/chinas-population-could-shrink-to-half-by-2100/"
}
{
"author": "Lex Rieffel, Xueqing Wang",
"date": "2024-05-01T12:00:03.881Z",
"description": "Is China’s future population drop a crisis or an opportunity?",
"image": "https://static.scientificamerican.com/dam/m/176839ae33b1cf57/original/chinaPopulation_lead.jpg?m=1713970359.405&w=1200",
"logo": "https://logo.clearbit.com/scientificamerican.com",
"publisher": "Scientific American",
"title": "China’s Population Could Shrink to Half by 2100",
"url": "https://www.scientificamerican.com/article/chinas-population-could-shrink-to-half-by-2100/"
}
{
"url": "https://www.scientificamerican.com/article/chinas-population-could-shrink-to-half-by-2100/",
"title": "China’s Population Could Shrink to Half by 2100",
"description": "China’s population of 1.4 billion people is the largest in the world, right? Not anymore. In 2023 India surpassed China as the most populous country. China’s population began shrinking in 2022, and the latest...",
"links": [
"https://www.scientificamerican.com/article/chinas-population-could-shrink-to-half-by-2100/"
],
"image": "https://static.scientificamerican.com/dam/m/176839ae33b1cf57/original/chinaPopulation_lead.jpg?m=1713970359.405&w=1200",
"content": "<div><p>China’s population of 1.4 billion people is the largest in the world, right? Not anymore. In 2023 India surpassed China as the most populous country. China’s population began shrinking in 2022, and the <a target=\"_blank\" href=\"https://population.un.org/wpp/\">latest United Nations report</a> indicates that it could slip to 1.3 billion in 2050 and then plummet to only 770 million in 2100.</p><p>As this news spreads, warnings of a looming crisis are growing louder. Perhaps most concerning of these is that China will not have enough young people to grow the economy or support older adults. But China’s declining populace could be a cause for opportunity rather than a crisis. China could arrive at a stable and sustainable population of around one billion in 2100. At this level, it is possible for the country to remain a global superpower and for its citizens to become even more prosperous, with its older adults well cared for. And China’s experience in making this transition could provide valuable lessons for many other countries that will have a declining population in the coming decades.</p><hr /><hr /><h2>On supporting science journalism</h2><p>If you're enjoying this article, consider supporting our award-winning journalism by <a target=\"_blank\" href=\"https://www.scientificamerican.com/getsciam/\">subscribing</a>. By purchasing a subscription you are helping to ensure the future of impactful stories about the discoveries and ideas shaping our world today.</p><hr /><p>The Chinese Communist Party has flipped its population policy twice since assuming power in 1949. Initially the policy was very pronatalist—it promoted reproduction and a high national birth rate. Then in 1979 a strict one-child policy was adopted alongside the economic reforms launched by former leader Deng Xiaoping that fueled China’s extraordinary economic rise. In 2015, prompted by a sharply falling birth rate, a pronatalist policy was reintroduced that allowed two-child families, and a policy that allowed three-child families was introduced in 2021.</p><p>The most recent policy statement came from Chinese president Xi Jinping in his address to the 13th National Women’s Congress in October 2023: “We should actively foster a new type of marriage and childbearing culture.” Other addresses at the Congress reflected a shift away from gender equality, even to the point of suggesting that women leave the labor force to have children. Such pronatalist policies run against the sentiment among a large segment of China’s youth, however. And many people do not want to have one or more children.</p><p>China’s population decline raises fundamental issues about childbearing, dependency ratios and “optimum” population size. Demographers have a way of describing a country’s population in a graphic: the population pyramid. It shows the number of male and female members of a population at a point in time, typically in five-year age groups, which is helpful for understanding societal issues.</p><p>China’s population in 1980 was around 980 million. It was distributed in the classic pyramid shape of a growing population: wider at the younger ages and narrower at the older ages. (See the graphic below.) One quirk was that there was a slightly smaller 20–24 age group than the 25–29 age group because of disruption caused by the Cultural Revolution, which began in 1966. The 15–19 and 10–14 age groups reflected a rebound. But the beginning of the 40-year trend toward smaller age groups could be seen in the five-to-nine and zero-to-four age groups. China’s one-child policy reinforced this trend, but other factors contributed, such as rapidly rising incomes, education, urbanization and better access to birth control.</p><figure><picture><source media=\"(min-width: 750px)\" srcset=\"https://static.scientificamerican.com/dam/m/5d484045465e8d86/original/chinaPopulation_graphic1_desktop.png?m=1714572065.439&amp;w=1350 1350w, https://static.scientificamerican.com/dam/m/5d484045465e8d86/original/chinaPopulation_graphic1_desktop.png?m=1714572065.439&amp;w=2000 2000w, https://static.scientificamerican.com/dam/m/5d484045465e8d86/original/chinaPopulation_graphic1_desktop.png?m=1714572065.439&amp;w=900 900w\" sizes=\"(min-width: 2000px) 2000px, (min-resolution: 3dppx) 50vw, (min-resolution: 2dppx) 75vw, 100vw\"></source><source media=\"(min-width: 0px)\" srcset=\"https://static.scientificamerican.com/dam/m/7d3cb36d18669eb2/original/chinaPopulation_graphic1_mobile.png?m=1714572065.439&amp;w=1000 1000w, https://static.scientificamerican.com/dam/m/7d3cb36d18669eb2/original/chinaPopulation_graphic1_mobile.png?m=1714572065.439&amp;w=1200 1200w, https://static.scientificamerican.com/dam/m/7d3cb36d18669eb2/original/chinaPopulation_graphic1_mobile.png?m=1714572065.439&amp;w=600 600w, https://static.scientificamerican.com/dam/m/7d3cb36d18669eb2/original/chinaPopulation_graphic1_mobile.png?m=1714572065.439&amp;w=750 750w\" sizes=\"(min-resolution: 3dppx) 50vw, (min-resolution: 2dppx) 75vw, 100vw\"></source><img alt=\"Chart shows China’s population distribution in 1980 in five-year age groups.\" src=\"https://static.scientificamerican.com/dam/m/5d484045465e8d86/original/chinaPopulation_graphic1_desktop.png?m=1714572065.439&amp;w=900\" srcset=\"https://static.scientificamerican.com/dam/m/5d484045465e8d86/original/chinaPopulation_graphic1_desktop.png?m=1714572065.439&amp;w=1000 1000w, https://static.scientificamerican.com/dam/m/5d484045465e8d86/original/chinaPopulation_graphic1_desktop.png?m=1714572065.439&amp;w=1200 1200w, https://static.scientificamerican.com/dam/m/5d484045465e8d86/original/chinaPopulation_graphic1_desktop.png?m=1714572065.439&amp;w=1350 1350w, https://static.scientificamerican.com/dam/m/5d484045465e8d86/original/chinaPopulation_graphic1_desktop.png?m=1714572065.439&amp;w=2000 2000w, https://static.scientificamerican.com/dam/m/5d484045465e8d86/original/chinaPopulation_graphic1_desktop.png?m=1714572065.439&amp;w=600 600w, https://static.scientificamerican.com/dam/m/5d484045465e8d86/original/chinaPopulation_graphic1_desktop.png?m=1714572065.439&amp;w=750 750w, https://static.scientificamerican.com/dam/m/5d484045465e8d86/original/chinaPopulation_graphic1_desktop.png?m=1714572065.439&amp;w=900 900w\" /></picture><figcaption></figcaption></figure><p>By 2020 these factors dramatically changed the shape of China’s population pyramid as its total population peaked at around 1.4 billion (below). The “bulge” of older people that is widely viewed as a future crisis can be clearly seen in the increased number of people aged 30–59.</p><p>An important factor is the dependency ratio, which compares the “dependent” population of youth (zero to 14 years of age) and older adults (aged 65 and older) to the working population between the ages of 15 and 64. In 1980 China’s ratio was 68 dependents for every 100 people of working age. In 2020 it was a more favorable 44 per 100. The coming bulge of older adults, however, will push the ratio up to a potentially socially destabilizing level—as much as 89 per 100 around 2085, according to our calculation.</p><figure><picture><source media=\"(min-width: 750px)\" srcset=\"https://static.scientificamerican.com/dam/m/43713898a273bb58/original/chinaPopulation_graphic2-3_desktop.png?m=1714415658.086&amp;w=1350 1350w, https://static.scientificamerican.com/dam/m/43713898a273bb58/original/chinaPopulation_graphic2-3_desktop.png?m=1714415658.086&amp;w=2000 2000w, https://static.scientificamerican.com/dam/m/43713898a273bb58/original/chinaPopulation_graphic2-3_desktop.png?m=1714415658.086&amp;w=900 900w\" sizes=\"(min-width: 2000px) 2000px, (min-resolution: 3dppx) 50vw, (min-resolution: 2dppx) 75vw, 100vw\"></source><source media=\"(min-width: 0px)\" srcset=\"https://static.scientificamerican.com/dam/m/f3d59bcbcb745e3/original/chinaPopulation_graphic2-3_mobile.png?m=1714415658.086&amp;w=1000 1000w, https://static.scientificamerican.com/dam/m/f3d59bcbcb745e3/original/chinaPopulation_graphic2-3_mobile.png?m=1714415658.086&amp;w=1200 1200w, https://static.scientificamerican.com/dam/m/f3d59bcbcb745e3/original/chinaPopulation_graphic2-3_mobile.png?m=1714415658.086&amp;w=600 600w, https://static.scientificamerican.com/dam/m/f3d59bcbcb745e3/original/chinaPopulation_graphic2-3_mobile.png?m=1714415658.086&amp;w=750 750w\" sizes=\"(min-resolution: 3dppx) 50vw, (min-resolution: 2dppx) 75vw, 100vw\"></source><img alt=\"Chart shows a comparison of China’s population structure in 1980 and 2020 and its dependency ratio in 2020 and 2050.\" src=\"https://static.scientificamerican.com/dam/m/43713898a273bb58/original/chinaPopulation_graphic2-3_desktop.png?m=1714415658.086&amp;w=900\" srcset=\"https://static.scientificamerican.com/dam/m/43713898a273bb58/original/chinaPopulation_graphic2-3_desktop.png?m=1714415658.086&amp;w=1000 1000w, https://static.scientificamerican.com/dam/m/43713898a273bb58/original/chinaPopulation_graphic2-3_desktop.png?m=1714415658.086&amp;w=1200 1200w, https://static.scientificamerican.com/dam/m/43713898a273bb58/original/chinaPopulation_graphic2-3_desktop.png?m=1714415658.086&amp;w=1350 1350w, https://static.scientificamerican.com/dam/m/43713898a273bb58/original/chinaPopulation_graphic2-3_desktop.png?m=1714415658.086&amp;w=2000 2000w, https://static.scientificamerican.com/dam/m/43713898a273bb58/original/chinaPopulation_graphic2-3_desktop.png?m=1714415658.086&amp;w=600 600w, https://static.scientificamerican.com/dam/m/43713898a273bb58/original/chinaPopulation_graphic2-3_desktop.png?m=1714415658.086&amp;w=750 750w, https://static.scientificamerican.com/dam/m/43713898a273bb58/original/chinaPopulation_graphic2-3_desktop.png?m=1714415658.086&amp;w=900 900w\" /></picture><figcaption></figcaption></figure><p>It is useful to put these images into a broader historical and global context. Around 1900 the global population began growing exponentially. The increase was driven primarily by falling death rates and reflected improvements in sanitation and public health. This trend produced a “demographic transition” from the historic pattern of birth rates closely matching death rates that yielded a slowly growing human population over millennia.</p><p>Around 2000 a global transition in the opposite direction became increasingly visible: birth rates started to fall below death rates, which began setting the stage for shrinking populations and rising dependency ratios. Almost all high-income and middle-income countries now face these prospects. Many of the countries with a population growing faster than 1 percent per year are low-income countries in Africa.</p><p>The population pyramids for India and Japan illustrate these trends. India’s pyramid (below) has the classic shape of a growing population. India has a favorable dependency ratio of 47 and a median age of 27.9—although smaller age groups at the bottom of the pyramid signal the beginning of the country’s transition toward a smaller population. The trend is too weak, however, to provide relief for India’s very high level of youth unemployment, which is considerably greater than China’s and has the potential to create social turmoil.</p><figure><picture><source media=\"(min-width: 750px)\" srcset=\"https://static.scientificamerican.com/dam/m/3c656ad85087f0de/original/chinaPopulation_graphic5_desktop.png?m=1713971358.118&amp;w=1350 1350w, https://static.scientificamerican.com/dam/m/3c656ad85087f0de/original/chinaPopulation_graphic5_desktop.png?m=1713971358.118&amp;w=2000 2000w, https://static.scientificamerican.com/dam/m/3c656ad85087f0de/original/chinaPopulation_graphic5_desktop.png?m=1713971358.118&amp;w=900 900w\" sizes=\"(min-width: 2000px) 2000px, (min-resolution: 3dppx) 50vw, (min-resolution: 2dppx) 75vw, 100vw\"></source><source media=\"(min-width: 0px)\" srcset=\"https://static.scientificamerican.com/dam/m/61945f8be52cbbe1/original/chinaPopulation_graphic5_mobile.png?m=1713971358.118&amp;w=1000 1000w, https://static.scientificamerican.com/dam/m/61945f8be52cbbe1/original/chinaPopulation_graphic5_mobile.png?m=1713971358.118&amp;w=1200 1200w, https://static.scientificamerican.com/dam/m/61945f8be52cbbe1/original/chinaPopulation_graphic5_mobile.png?m=1713971358.118&amp;w=600 600w, https://static.scientificamerican.com/dam/m/61945f8be52cbbe1/original/chinaPopulation_graphic5_mobile.png?m=1713971358.118&amp;w=750 750w\" sizes=\"(min-resolution: 3dppx) 50vw, (min-resolution: 2dppx) 75vw, 100vw\"></source><img alt=\"Chart shows India’s population distribution in 2020 in five-year age groups.\" src=\"https://static.scientificamerican.com/dam/m/3c656ad85087f0de/original/chinaPopulation_graphic5_desktop.png?m=1713971358.118&amp;w=900\" srcset=\"https://static.scientificamerican.com/dam/m/3c656ad85087f0de/original/chinaPopulation_graphic5_desktop.png?m=1713971358.118&amp;w=1000 1000w, https://static.scientificamerican.com/dam/m/3c656ad85087f0de/original/chinaPopulation_graphic5_desktop.png?m=1713971358.118&amp;w=1200 1200w, https://static.scientificamerican.com/dam/m/3c656ad85087f0de/original/chinaPopulation_graphic5_desktop.png?m=1713971358.118&amp;w=1350 1350w, https://static.scientificamerican.com/dam/m/3c656ad85087f0de/original/chinaPopulation_graphic5_desktop.png?m=1713971358.118&amp;w=2000 2000w, https://static.scientificamerican.com/dam/m/3c656ad85087f0de/original/chinaPopulation_graphic5_desktop.png?m=1713971358.118&amp;w=600 600w, https://static.scientificamerican.com/dam/m/3c656ad85087f0de/original/chinaPopulation_graphic5_desktop.png?m=1713971358.118&amp;w=750 750w, https://static.scientificamerican.com/dam/m/3c656ad85087f0de/original/chinaPopulation_graphic5_desktop.png?m=1713971358.118&amp;w=900 900w\" /></picture><figcaption></figcaption></figure><p>Japan’s pyramid is distinctly top-heavy, with an unfavorable dependency ratio of 71 and a median age of 48.7, reflecting a strong demographic transition that began 45 years ago. It is hard to avoid a sense of crisis. The U.N. forecast has Japan’s population falling from 125 million in 2020 to 75 million in 2100.</p><figure><picture><source media=\"(min-width: 750px)\" srcset=\"https://static.scientificamerican.com/dam/m/4bd56fb1b5bbccb1/original/chinaPopulation_graphic4_desktop.png?m=1713971443.467&amp;w=1350 1350w, https://static.scientificamerican.com/dam/m/4bd56fb1b5bbccb1/original/chinaPopulation_graphic4_desktop.png?m=1713971443.467&amp;w=2000 2000w, https://static.scientificamerican.com/dam/m/4bd56fb1b5bbccb1/original/chinaPopulation_graphic4_desktop.png?m=1713971443.467&amp;w=900 900w\" sizes=\"(min-width: 2000px) 2000px, (min-resolution: 3dppx) 50vw, (min-resolution: 2dppx) 75vw, 100vw\"></source><source media=\"(min-width: 0px)\" srcset=\"https://static.scientificamerican.com/dam/m/7214a46f33b6c5b7/original/chinaPopulation_graphic4_mobile.png?m=1713971443.467&amp;w=1000 1000w, https://static.scientificamerican.com/dam/m/7214a46f33b6c5b7/original/chinaPopulation_graphic4_mobile.png?m=1713971443.467&amp;w=1200 1200w, https://static.scientificamerican.com/dam/m/7214a46f33b6c5b7/original/chinaPopulation_graphic4_mobile.png?m=1713971443.467&amp;w=600 600w, https://static.scientificamerican.com/dam/m/7214a46f33b6c5b7/original/chinaPopulation_graphic4_mobile.png?m=1713971443.467&amp;w=750 750w\" sizes=\"(min-resolution: 3dppx) 50vw, (min-resolution: 2dppx) 75vw, 100vw\"></source><img alt=\"Chart shows Japan’s population distribution in 2020 in five-year age groups.\" src=\"https://static.scientificamerican.com/dam/m/4bd56fb1b5bbccb1/original/chinaPopulation_graphic4_desktop.png?m=1713971443.467&amp;w=900\" srcset=\"https://static.scientificamerican.com/dam/m/4bd56fb1b5bbccb1/original/chinaPopulation_graphic4_desktop.png?m=1713971443.467&amp;w=1000 1000w, https://static.scientificamerican.com/dam/m/4bd56fb1b5bbccb1/original/chinaPopulation_graphic4_desktop.png?m=1713971443.467&amp;w=1200 1200w, https://static.scientificamerican.com/dam/m/4bd56fb1b5bbccb1/original/chinaPopulation_graphic4_desktop.png?m=1713971443.467&amp;w=1350 1350w, https://static.scientificamerican.com/dam/m/4bd56fb1b5bbccb1/original/chinaPopulation_graphic4_desktop.png?m=1713971443.467&amp;w=2000 2000w, https://static.scientificamerican.com/dam/m/4bd56fb1b5bbccb1/original/chinaPopulation_graphic4_desktop.png?m=1713971443.467&amp;w=600 600w, https://static.scientificamerican.com/dam/m/4bd56fb1b5bbccb1/original/chinaPopulation_graphic4_desktop.png?m=1713971443.467&amp;w=750 750w, https://static.scientificamerican.com/dam/m/4bd56fb1b5bbccb1/original/chinaPopulation_graphic4_desktop.png?m=1713971443.467&amp;w=900 900w\" /></picture><figcaption></figcaption></figure><hr /><p>A country’s population is shaped primarily by its birth rate and death rate. In today’s world, with widely available means of family planning, the number of births in high-income countries is largely determined by the number of children people want to have. The number of deaths is determined by a complex set of biological, social and environmental factors. Migration is an important factor in some countries.</p><p>The total fertility rate (TFR) is the number of children an individual of childbearing age will have, on average, in their lifetime. A TFR of 2.1 yields a stable population over time. Population will rise in a country with a TFR above 2.1 and fall with a TFR below 2.1. In 2020 Niger had the world’s highest TFR, at 6.89. South Korea had the lowest, at 0.89.</p><p>China’s TFR was 5.8 in 1970. Over the next 20 years it slid slowly and then rapidly toward the replacement level of 2.1. In the 1990s it dropped much further, and it reached a U.N. estimate of 1.18, one of the lowest in the world, in 2022.</p><p>For any country a TFR this small is bad news. But people who see China’s low rate as a crisis are misled by a common forecasting practice that often leads to unrealistic conclusions: they are extrapolating China’s current rate indefinitely into the future. In particular, the U.N. World Population Prospects report for 2022 used a roughly constant TFR of 1.18 to forecast that China’s population will fall to 770 million in 2100.</p><p>The pyramid that results from this forecast (below) is dramatically different from the one for 2020. The 770 million number comes from the U.N.’s “medium scenario.” The high scenario is 1.15 billion and the low scenario is a shocking 494 million.</p><figure><picture><source media=\"(min-width: 750px)\" srcset=\"https://static.scientificamerican.com/dam/m/34938022354cbef0/original/chinaPopulation_graphic6_desktop.png?m=1713971548.591&amp;w=1350 1350w, https://static.scientificamerican.com/dam/m/34938022354cbef0/original/chinaPopulation_graphic6_desktop.png?m=1713971548.591&amp;w=2000 2000w, https://static.scientificamerican.com/dam/m/34938022354cbef0/original/chinaPopulation_graphic6_desktop.png?m=1713971548.591&amp;w=900 900w\" sizes=\"(min-width: 2000px) 2000px, (min-resolution: 3dppx) 50vw, (min-resolution: 2dppx) 75vw, 100vw\"></source><source media=\"(min-width: 0px)\" srcset=\"https://static.scientificamerican.com/dam/m/6de939f6d64ead10/original/chinaPopulation_graphic6_mobile.png?m=1713971548.591&amp;w=1000 1000w, https://static.scientificamerican.com/dam/m/6de939f6d64ead10/original/chinaPopulation_graphic6_mobile.png?m=1713971548.591&amp;w=1200 1200w, https://static.scientificamerican.com/dam/m/6de939f6d64ead10/original/chinaPopulation_graphic6_mobile.png?m=1713971548.591&amp;w=600 600w, https://static.scientificamerican.com/dam/m/6de939f6d64ead10/original/chinaPopulation_graphic6_mobile.png?m=1713971548.591&amp;w=750 750w\" sizes=\"(min-resolution: 3dppx) 50vw, (min-resolution: 2dppx) 75vw, 100vw\"></source><img alt=\"Chart shows China’s population distribution forecast in 2100.\" src=\"https://static.scientificamerican.com/dam/m/34938022354cbef0/original/chinaPopulation_graphic6_desktop.png?m=1713971548.591&amp;w=900\" srcset=\"https://static.scientificamerican.com/dam/m/34938022354cbef0/original/chinaPopulation_graphic6_desktop.png?m=1713971548.591&amp;w=1000 1000w, https://static.scientificamerican.com/dam/m/34938022354cbef0/original/chinaPopulation_graphic6_desktop.png?m=1713971548.591&amp;w=1200 1200w, https://static.scientificamerican.com/dam/m/34938022354cbef0/original/chinaPopulation_graphic6_desktop.png?m=1713971548.591&amp;w=1350 1350w, https://static.scientificamerican.com/dam/m/34938022354cbef0/original/chinaPopulation_graphic6_desktop.png?m=1713971548.591&amp;w=2000 2000w, https://static.scientificamerican.com/dam/m/34938022354cbef0/original/chinaPopulation_graphic6_desktop.png?m=1713971548.591&amp;w=600 600w, https://static.scientificamerican.com/dam/m/34938022354cbef0/original/chinaPopulation_graphic6_desktop.png?m=1713971548.591&amp;w=750 750w, https://static.scientificamerican.com/dam/m/34938022354cbef0/original/chinaPopulation_graphic6_desktop.png?m=1713971548.591&amp;w=900 900w\" /></picture><figcaption></figcaption></figure><p>But the pyramid above is just a snapshot of what this will look like. As the years advance, the bulge of older people in China’s 2020 pyramid will move up and peak around 2050. And unless some medical breakthroughs prolong life expectancy well beyond 100 years, the bulge will be gone by 2130.</p><p>In other words, China has 27 years (from 2023 to 2050) to adjust to the peak bulge of its older population and then another 80 years (from 2050 to 2130) during which the bulge will shrink steadily until it has disappeared. This bulge should be manageable because it is a transition phenomenon playing out over decades and because it might not take radical policy reforms in the short term to make life pleasant for people who have reached retirement age.</p><p>In 2019 the Chinese government released a “National Mid and Long-Term Plan for Actively Responding to Population Aging.” In the decades ahead, the most obvious policy adjustment would be to keep people in the workforce longer. Most men in China currently retire at age 60, whereas women in white-collar jobs retire at age 55 and women in blue-collar jobs at age 50. The 2019 plan set the stage for the Chinese government’s announcement in 2021 that it would gradually increase the legal retirement age.</p><p>China's aging population is already spurring rapid development in the caregiving industry. In Shanghai, for example, an online platform has been created that connects families seeking caregiving assistance with available caregivers. China might find useful ideas from other countries, too. The political pressures in Japan, Korea and Taiwan to address their bulge in the older population is especially strong, and these countries may implement some effective policies and programs. A great deal of experimentation is underway in European countries, most of which have TFRs below replacement level. In the U.S., one response is the aging-in-place “village movement,” which is helping older adults in urban communities to remain in their own home through cooperative support.</p><hr /><p>Today the social environment for Chinese people of childbearing age is uncertain and confusing. Chinese women are caught between the patriarchal demand that treats childbearing as normative and the authoritarian state’s pronatalist push, said Yun Zhou of the University of Michigan in <a target=\"_blank\" href=\"https://www.csis.org/events/chinas-demographic-challenges\">a November 2023 webinar</a>.</p><p>The biggest drivers of China’s falling TFR appear to be the generally rising living standard and educational advancement of women. Most empirical evidence around the world shows that women with more education have fewer children. This partly comes from marrying later. It is also caused by not wanting to lose income by leaving work to raise a child. One obvious policy adjustment would be to greatly expand childcare facilities. Another would be to adopt generous maternity leave policies with continuing employment guaranteed.</p><p>Future trends worldwide are also unclear. Artificial intelligence and robotics will be powerful drivers of change, for example. The policy challenges for all countries with a shrinking population will be great, and they are likely to be even greater for countries with a growing population. Nigeria, for example, is on track to double its population in the next 40 years from around 220 million to 440 million people, overtaking projections for the U.S. as the third most populous country in the world.</p><p>Underlying everything the government of China is considering to slow its population decline—and the reactions of commentators who see the decline as a crisis—is concern that a smaller population will make China economically weaker and diminish its influence in the world. This is where public opinion and policy debate may be the most misguided.</p><p>If the measure of economic progress in China is growth in gross domestic product (GDP), then a shrinking population would be a contributing factor holding back GDP growth. But China’s population is becoming better educated. The country is also installing more industrial robots than any other nation. There is no plausible reason to believe that China’s economic productivity will stop increasing. There is also no experience in the rest of the world that validates the concern that a smaller population will undermine China’s status as a global superpower.</p><p>The size of a country’s population has never been a good measure of the well-being of its inhabitants, either. Economists have not yet adopted a widely accepted way of measuring well-being. But China now has the potential to pioneer policies that stabilize a shrinking population, raise productivity and enhance well-being. These policies can inspire other countries in the same situation while at the same time helping the world overcome the existential threat of climate change.</p><hr /><p>Curiously, the debate about population in China—or the world—is never cast in terms of an “optimum population size.” Debates on setting specific targets for population size or growth have become contentious because of concerns over coercion. In addition, there is a prevailing perception in the Global South that population stabilization efforts are strategies favored by the Global North so it maintains its hegemony.</p><p>Yet worldwide it seems clear that no population larger than the current eight billion is sustainable at the current living standard of the global middle class. It is even less sustainable at the standard of high-income countries. The U.N. could contribute meaningfully to the climate-change debate by identifying an approximate population size for the world in 2050 or 2100 that would be more sustainable given resource and technology constraints.</p><p>A robust concept of optimum population size is not static, however. It changes over time as technology advances, natural resources are extracted and countries evolve socially. For example, there may be a time when a global population greater than eight billion will be sustainable if nuclear fusion power becomes feasible and vegetarian protein replaces meat-based protein in diets. It should also be scientifically possible to identify a smaller global population that can be supported at a generally higher standard of living without aggravating global warming and reducing biodiversity.</p><p>We are not proposing an optimum population size for China. But here is one plausible scenario toward a smaller and more sustainable population, albeit one that many demographers might deem overly optimistic. On this path, which we have calculated, China’s TFR stabilizes for the next 20 years and then starts rising, approaching the 2.1 replacement level around the beginning of the next century. That yields a total population around 1.2 billion,in contrast to the U.N.’s forecast of 770 million. Based on an alternative demographic path we calculated, China’s population pyramid in 2100 would look much less alarming (below). China could become even more influential globally if it follows this kind of path.</p><figure><picture><source media=\"(min-width: 750px)\" srcset=\"https://static.scientificamerican.com/dam/m/736f93a6ee2ba04a/original/chinaPopulation_graphic7_desktop.png?m=1713971638.64&amp;w=1350 1350w, https://static.scientificamerican.com/dam/m/736f93a6ee2ba04a/original/chinaPopulation_graphic7_desktop.png?m=1713971638.64&amp;w=2000 2000w, https://static.scientificamerican.com/dam/m/736f93a6ee2ba04a/original/chinaPopulation_graphic7_desktop.png?m=1713971638.64&amp;w=900 900w\" sizes=\"(min-width: 2000px) 2000px, (min-resolution: 3dppx) 50vw, (min-resolution: 2dppx) 75vw, 100vw\"></source><source media=\"(min-width: 0px)\" srcset=\"https://static.scientificamerican.com/dam/m/4f9ac7b65a88d2b9/original/chinaPopulation_graphic7_mobile.png?m=1713971638.64&amp;w=1000 1000w, https://static.scientificamerican.com/dam/m/4f9ac7b65a88d2b9/original/chinaPopulation_graphic7_mobile.png?m=1713971638.64&amp;w=1200 1200w, https://static.scientificamerican.com/dam/m/4f9ac7b65a88d2b9/original/chinaPopulation_graphic7_mobile.png?m=1713971638.64&amp;w=600 600w, https://static.scientificamerican.com/dam/m/4f9ac7b65a88d2b9/original/chinaPopulation_graphic7_mobile.png?m=1713971638.64&amp;w=750 750w\" sizes=\"(min-resolution: 3dppx) 50vw, (min-resolution: 2dppx) 75vw, 100vw\"></source><img alt=\"Chart shows China’s adjusted population forecast in 2100 if fertility rate rises.\" src=\"https://static.scientificamerican.com/dam/m/736f93a6ee2ba04a/original/chinaPopulation_graphic7_desktop.png?m=1713971638.64&amp;w=900\" srcset=\"https://static.scientificamerican.com/dam/m/736f93a6ee2ba04a/original/chinaPopulation_graphic7_desktop.png?m=1713971638.64&amp;w=1000 1000w, https://static.scientificamerican.com/dam/m/736f93a6ee2ba04a/original/chinaPopulation_graphic7_desktop.png?m=1713971638.64&amp;w=1200 1200w, https://static.scientificamerican.com/dam/m/736f93a6ee2ba04a/original/chinaPopulation_graphic7_desktop.png?m=1713971638.64&amp;w=1350 1350w, https://static.scientificamerican.com/dam/m/736f93a6ee2ba04a/original/chinaPopulation_graphic7_desktop.png?m=1713971638.64&amp;w=2000 2000w, https://static.scientificamerican.com/dam/m/736f93a6ee2ba04a/original/chinaPopulation_graphic7_desktop.png?m=1713971638.64&amp;w=600 600w, https://static.scientificamerican.com/dam/m/736f93a6ee2ba04a/original/chinaPopulation_graphic7_desktop.png?m=1713971638.64&amp;w=750 750w, https://static.scientificamerican.com/dam/m/736f93a6ee2ba04a/original/chinaPopulation_graphic7_desktop.png?m=1713971638.64&amp;w=900 900w\" /></picture><figcaption></figcaption></figure><p>In general, countries with a declining population need not make policy adjustments with great urgency. Changes can be adopted over several generations, with lots of experimentation. Indeed, with no fanfare, a lot of adjustments are already moving countries in the direction of smaller and more harmonious populaces.</p><p>For example, governments in many countries are reassessing mandatory retirement ages to encourage more years of employment. They are changing pension schemes to make them fiscally sustainable for longer periods. They are making it easier for people to have children by making fertility treatments more accessible, extending parental leave and expanding childcare facilities. Perhaps the most crucial policy reforms will be those that support a very different work-life balance as artificial intelligence and robotics redefine employment. Some radical solutions will inevitably emerge, possibly including the implementation of a universal basic income for all adults.</p><p>Fundamentally, the decisions made by young and old people in countries with a declining population will determine how quickly and smoothly a country arrives at a stable and sustainable population. Policies will shape the path, but the bottom-up actions of the people will be the difference between countries that make the transition peacefully and those that experience serious disorder.</p></div>",
"author": "Lex Rieffel, Xueqing Wang",
"favicon": "",
"source": "scientificamerican.com",
"published": "2024-05-01t08:00:00-04:00",
"ttr": 503,
"type": "article"
}